Information is key in today’s world. Utilize Designs.ai’s Stunning Infographics to create captivating visuals from your data. Infographics are visual representations of information and data, presenting complex information in an easy-to-understand format. With Designs.ai’s Graphics, creating stunning infographics has never been easier.
Designs.ai is a leading provider of A.I. tools, with products that include Speechmaker for speechwriting, and Graphicmaker for creating stunning designs. The Graphicmaker tool is an excellent tool for creating infographics, and it’s easy to use even for those with limited design experience.
Tips to create stunning infographic
To create a stunning infographic, there are some tips that you can follow. The first is to make sure that the information you are presenting is accurate and relevant. You want your audience to trust your data, and if it’s inaccurate or outdated, it can undermine your entire message. You also want to make sure that the information is presented in a logical and easy-to-understand format.
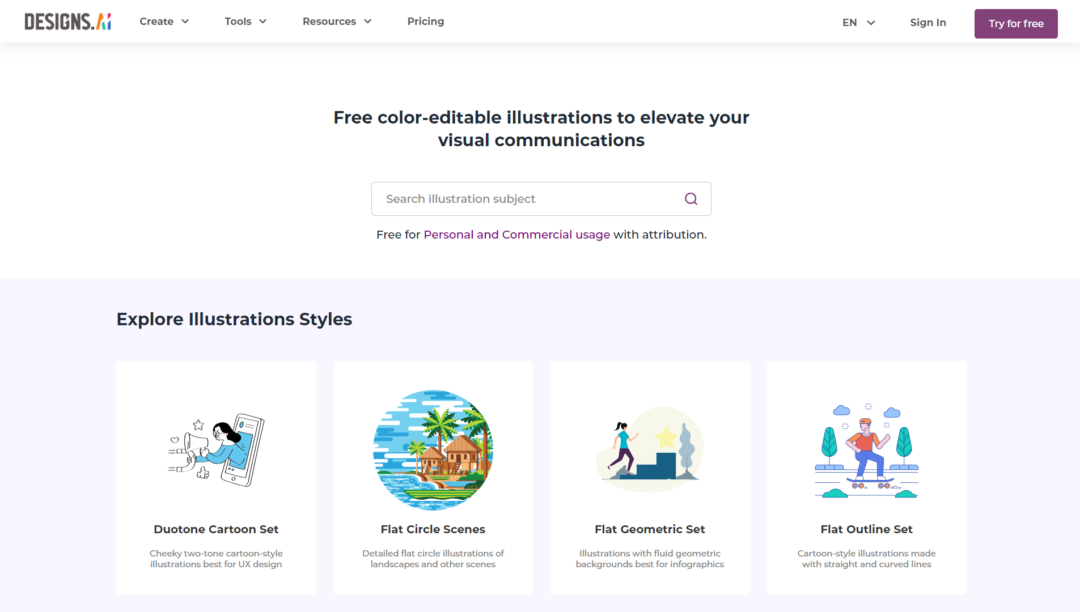
Another tip for creating a great infographic is to choose the right design elements. You want to make sure that your infographic is visually appealing and easy to read. This includes choosing the right fonts, colors, and images. With Designs.ai’s Graphics, you have access to a vast library of design elements, making it easy to create a stunning infographic that looks professional and polished.
How-to infographic
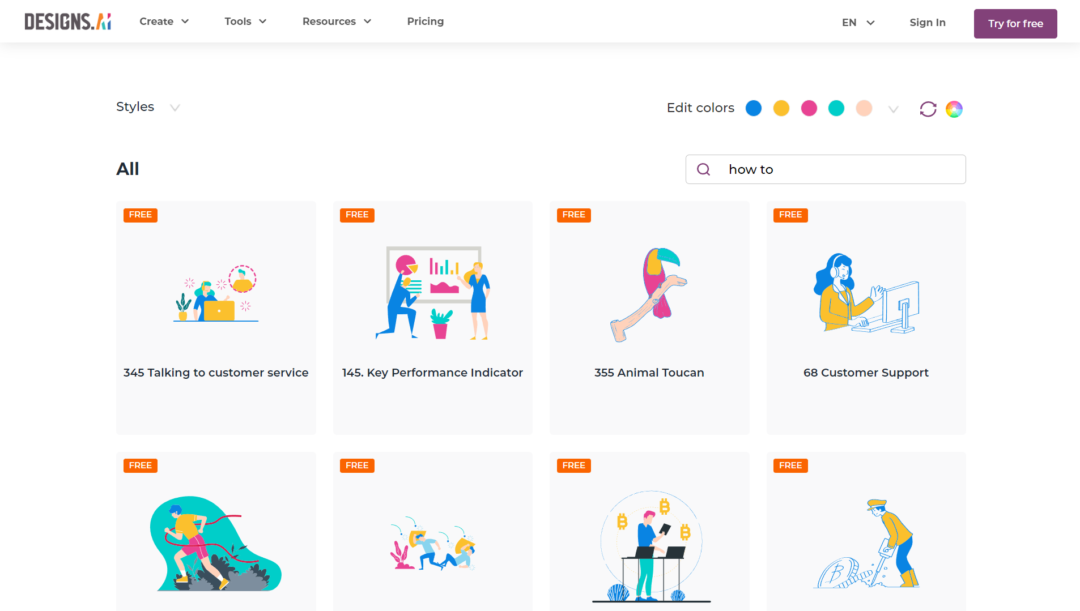
One of the most popular types of infographics is the “how-to” infographic. These infographics provide step-by-step instructions on how to do something, such as cook a meal, fix a car, or build a website. These infographics are popular because they are easy to follow and provide valuable information. With Designs.ai’s Graphicmaker, you can easily create a how-to infographic that is both informative and visually appealing.
Another popular type of infographic is the comparison infographic. These infographics compare two or more things, such as different products or services. These infographics are popular because they allow the viewer to quickly see the differences between the items being compared. With Designs.ai’s Graphics, creating a comparison infographic is easy, and you can customize it to fit your specific needs.
Data and statistic infographics
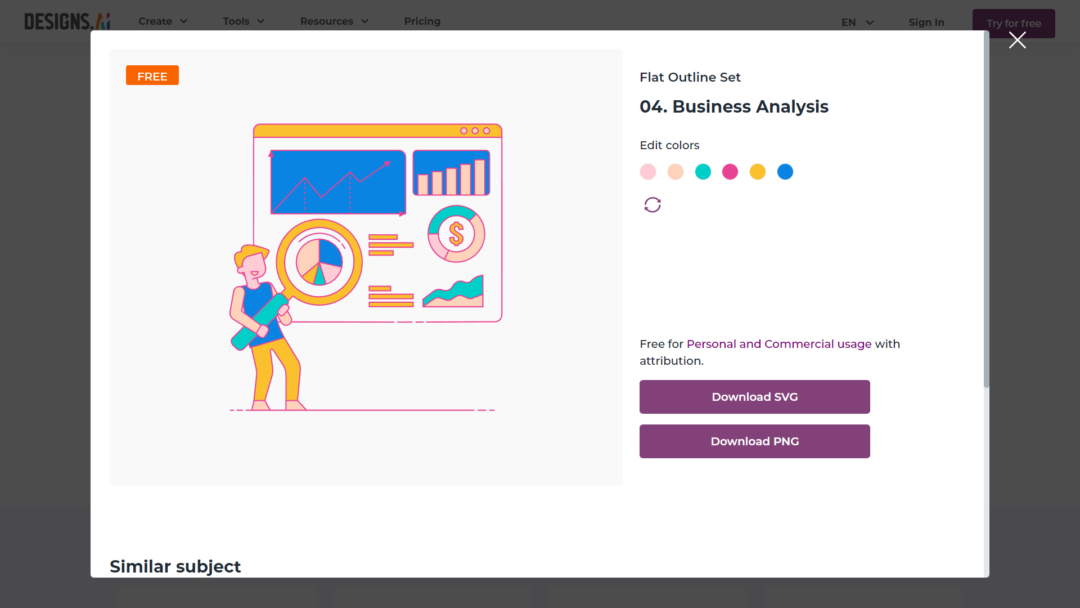
Infographics are also great for presenting data and statistics. A well-designed infographic can make even the most complex data easy to understand. With Designs.ai’s Graphicmaker, you can create a data-driven infographic that is both informative and visually appealing.
In conclusion, infographics are a powerful tool for presenting information in a way that is both informative and visually appealing. With Designs.ai’s Graphics, creating stunning infographics has never been easier. Whether you are creating a how-to infographic, a comparison infographic, or a data-driven infographic, Designs.ai’s Graphicmaker has everything you need to create a professional-looking design. So, do utilize Designs.ai’s stunning infographics and see how it can take your graphics to the next level!
Struggling to boost your brand’s identity? Check out our blog for 5 tips to elevate your brand identity using stock photos here!